Unit 4: Interval & Ratio Tests
Outline
4.1 Hypothesis
| • The null hypothesis is the hypothesis that sample observations results purely from chance. • The alternative hypothesis is the hypothesis that sample observations are influenced from some non-random cause, and that there is significance in the population. |
4.2 Need for Statistical Tests
| Statistical tests indicate whether observations are significant or due to sample error. (p < .05) indicates that the probability of error is less than 5%, or that the results are significant at the .05 level. |
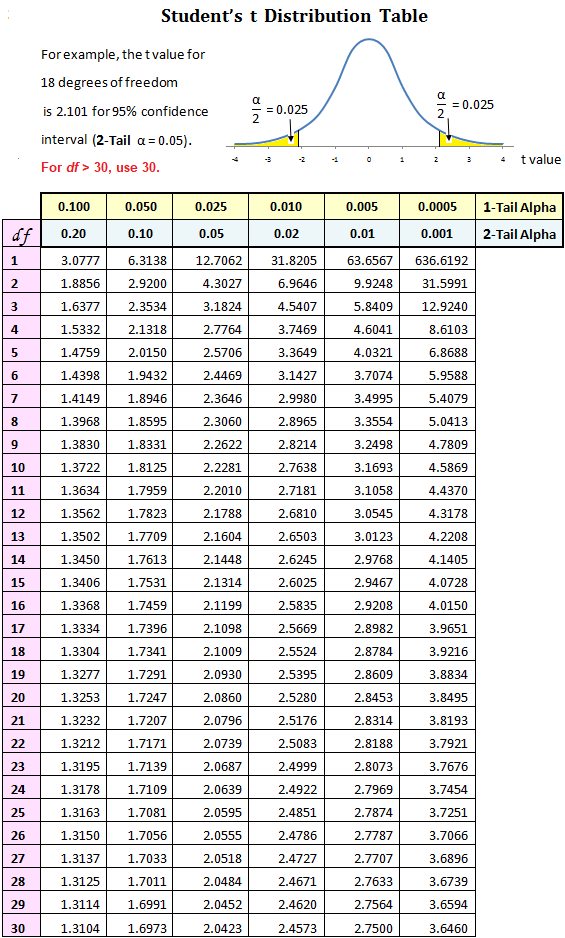
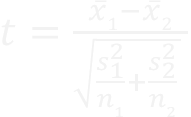
4.3 The T-Test
| The t-test is used to compare the means of two groups. If t is greater than the critical value, reject the null hypothesis and assume the difference between the group means is significant. Use the formula below to calculate t. Find the critical value from the t-table. |
4.4 One-way Analysis of Variance (ANOVA)
| Use the ANOVA worksheet to calculate the f-statistic. Look up the critical value for f in the f-table (on the back of the worksheet). If f is equal to or greater than the critical value, then reject the null hypothesis. |
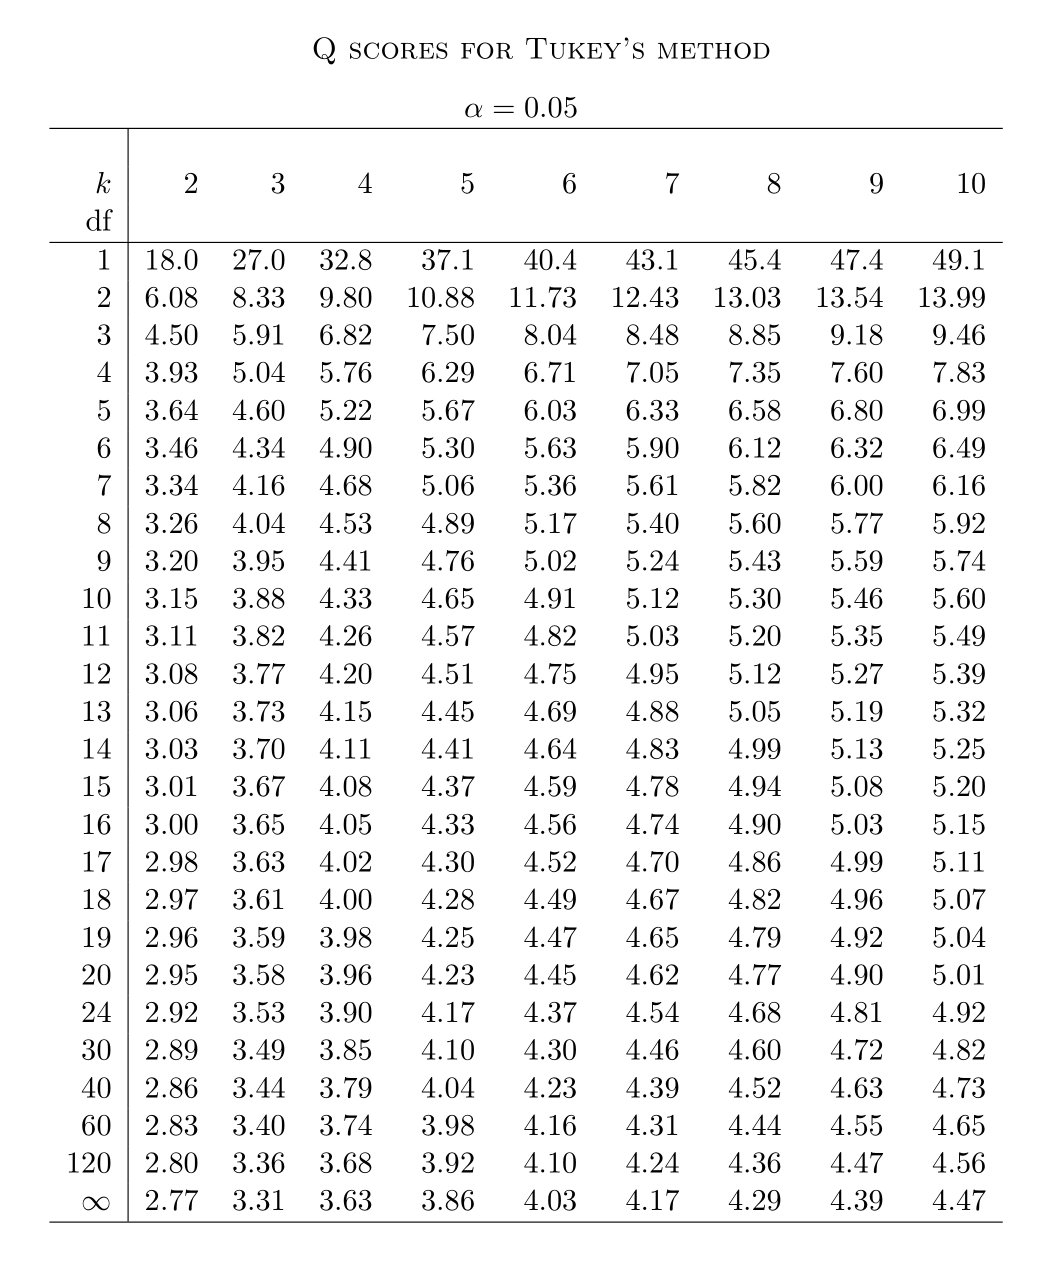
4.5 Post-hoc Tests
| Post-hoc tests indicate which group means are statistically significantly different. Tukey’s HSD (honestly significant difference) Test: • Find q in the q-table. • Use the formula below for HSD. |

Resources

Lecture
Notes

Work
Sheet

Unit
Project

Study
Guide

Self-Scorers:
T-Test & ANOVA
| Do not request access. Use your google account (or create one for free). Open the spreadsheet, click on <File> and <Make a copy>. Enter your data. Errors will be highlighted. When the project is complete/correct, record your receipt number. |