Unit 2: Descriptive Statistics
Outline
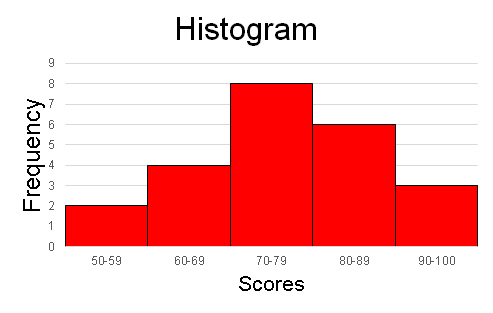
2.1 Types of Figures
| • Histogram: Continuous • Bar Graph: Categorical • Frequency Polygon |
2.2 Shapes of Curves
2.3 Measures of Central Tendency
| • Mean: The average • Median: The middle • Mode: The highest frequency |
| • Range: the difference between the highest score and the lowest score in a set of scores. • Interquartile Range: The range of the middle 50% (IQR = Q3 – Q1). • Standard Deviation: The measure that indicates the degree to which the scores vary from the mean |
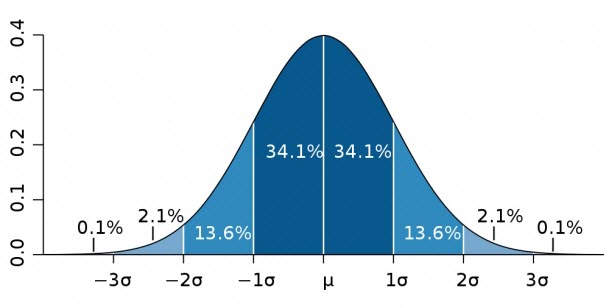
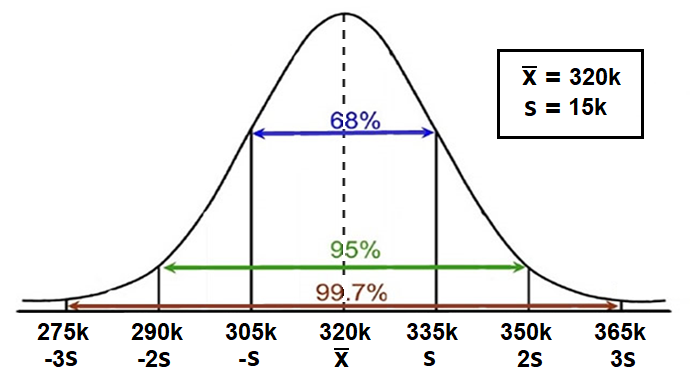
2.5 The 68-95-99.7 Rule for Normal Distributions
| • 68% of scores lie within one standard deviation from the mean. • 95% of scores lie within two standard deviations from the mean. • 99.7% of scores lie within three standard deviations from the mean. |
Resources

Lecture
Notes

Work
Sheet

Unit
Project

Study
Guide

Self-Scorers:
Descriptive Statistics
| Do not request access. Use your google account (or create one for free). Open the spreadsheet, click on <File> and <Make a copy>. Enter your data. Errors will be highlighted. When the project is complete/correct, record your receipt number. |