Unit 3: Inferential Statistics
Outline
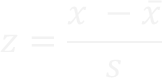
3.1 Standard Scores (z-scores)
| A z-score is an individual score in terms of standard deviations, and indicates percentile rank (see the z-tables). |
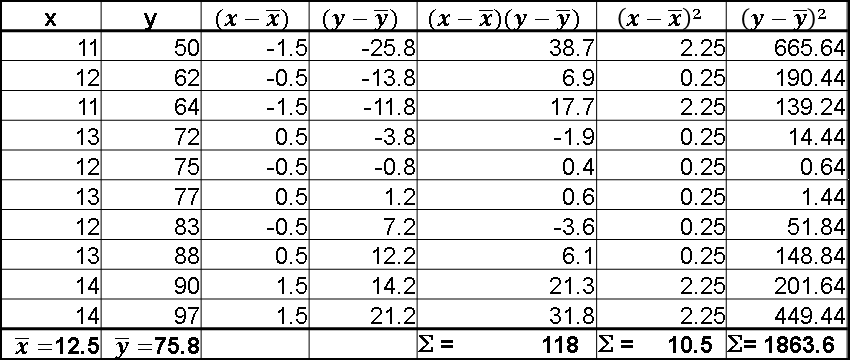
3.2 Correlation (Pearson)
| A correlation indicates strength and direction of the relationship between two variables, does not indicate causation, but allows us to make predictions. |
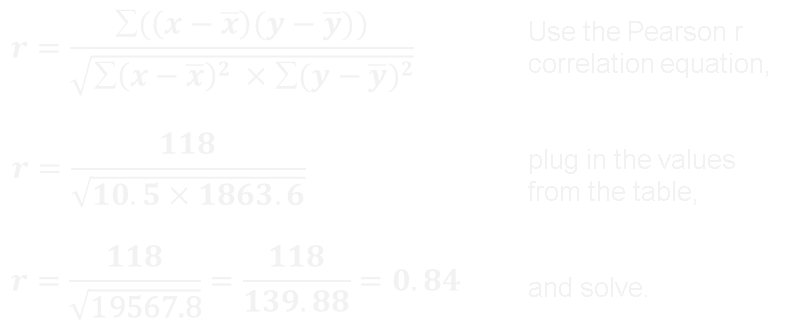
3.3 Coefficient of Determination
| Indicates how much variance of one variable can be explained by another variable. If r = 0.84, then r-squared = 0.71, indicating that 71% of the variance of one variable can be explained by the other variable. |
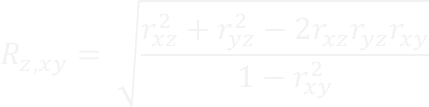
3.4 Multiple Correlation
| Allows us to use more than one variable to predict another variable. |
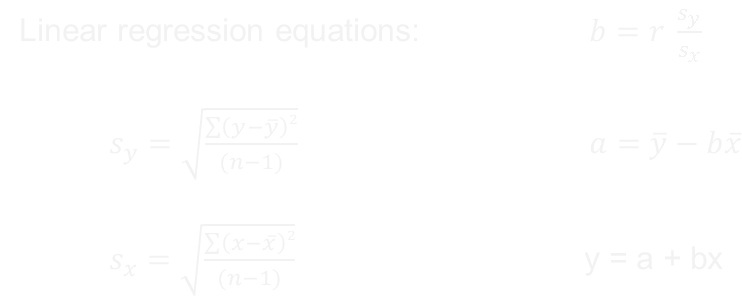
3.5 Linear Regression
| Calculate a regression line to make a precise prediction. |
Resources

Lecture
Notes

Work
Sheet

Unit
Project

Study
Guide

Self-Scorers:
Linear Regression
| Do not request access. Use your google account (or create one for free). Open the spreadsheet, click on <File> and <Make a copy>. Enter your data. Errors will be highlighted. When the project is complete/correct, record your receipt number. |